
Promises are easy; repeatable returns are not. In AI, the difference often comes down to control: building systems that behave predictably, align with policy, and stay useful as conditions change. By “on-model” AI, we mean solutions engineered to operate within clearly defined constraints-brand, risk, compliance, cost-so performance can be measured, trusted, and improved.
This article gathers real client stories across sectors to show what that looks like in practice. Each case starts with the baseline problem, follows the design choices that kept the system “on-model,” and ends with outcomes that matter: time saved, dollars returned, errors reduced, risks avoided. You’ll see where the lift came from-and where it didn’t-along with the trade-offs behind the numbers.
We also surface the unglamorous lessons: data readiness, governance, human-in-the-loop design, evaluation methods, and change management. The aim isn’t to offer a silver bullet, but to provide clear patterns and pitfalls so you can move from promising pilots to accountable production, with confidence grounded in evidence.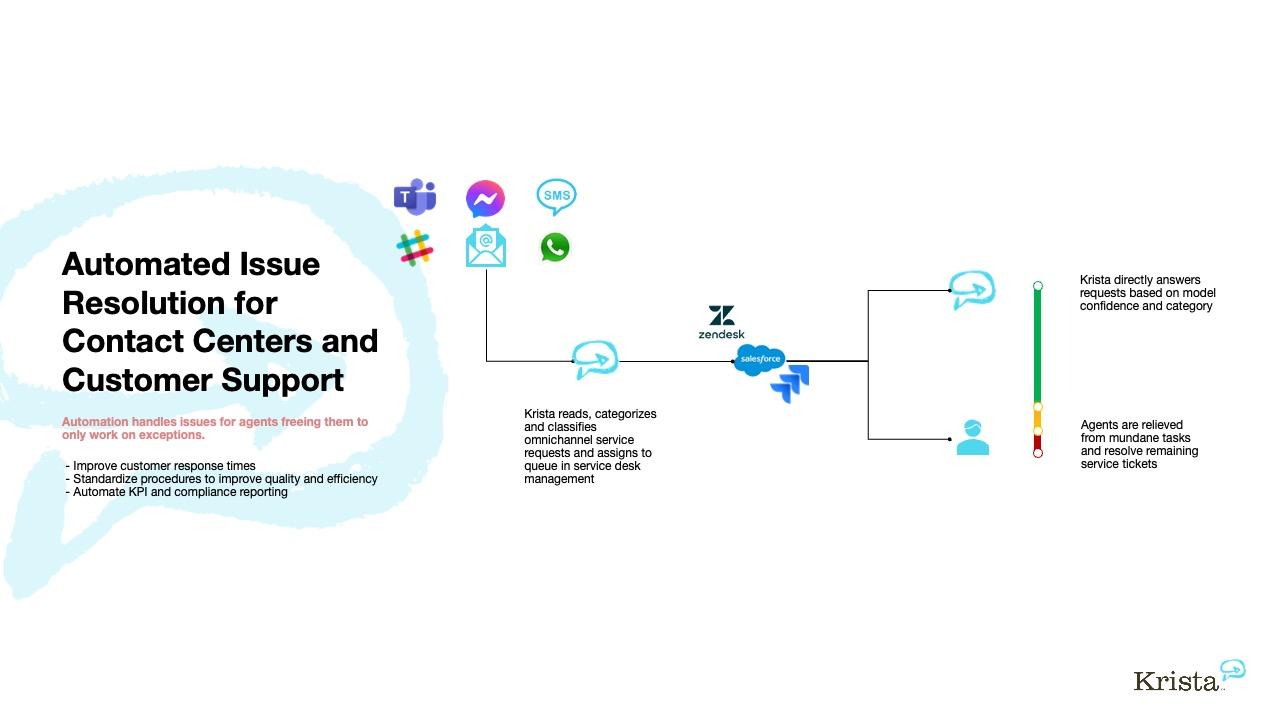
Where on model AI delivered value: customer service resolution, risk triage, and demand forecasting
In support operations, “on-model” meant the assistant didn’t guess-it acted within policy graphs, entitlements, and SLA timers. The result was faster, first-contact solutions for billing, refunds, and warranty questions, with the model grounding answers in approved excerpts and orchestrating backend actions via secure playbooks. Agents received concise, context-rich summaries instead of raw transcripts, cutting swivel-chair toil and shrinking queue volatility. Measured against the same KPIs as humans, the system delivered fewer reopens and crisper root-cause notes that improved downstream knowledge hygiene and template quality, turning every resolved ticket into fuel for continuous learning.
- Customer sentiment to action: Real-time intent + entitlement check → pre-approved resolution paths
- Grounded responses: Retrieval from policy snippets, order status, and past cases
- Human-in-the-loop: Escalation with rationale, confidence, and editable drafts
- KPI-aligned: Optimized for CSAT, AHT, FCR-not word count
| Use Case | Baseline | With On‑Model AI | ROI Snapshot |
|---|---|---|---|
| Customer Service | AHT 9m, FCR 58% | AHT 5.4m, FCR 73% | 31% cost per contact ↓ |
| Risk Triage | Manual review 100% | Auto-clear 62% low-risk | False positives ↓ 41% |
| Demand Forecasting | MAPE 18% | MAPE 11% | Carry cost ↓ 9% |
In risk, the model acted as a calibrated gatekeeper. It fused transaction meta, behavioral patterns, and policy thresholds to pre-score claims and chargebacks, routing only ambiguous items to analysts-with transparent features and confidence to support audit. In planning, the forecaster blended historical sales with promotions, weather, and local events, producing SKU-store forecasts that respected seasonality and operational constraints. Teams trusted the outputs because the system explained “why,” simulated scenarios, and stayed inside governance rails. The pattern was consistent: keep the model on doctrine, instrument the business metrics, and let humans make the final calls where stakes or uncertainty spike.
- Risk triage signals: Time-to-first-transaction, device graph, dispute lineage, velocity spikes
- Forecast enrichments: Promo calendars, price elasticity, lead-time variability, weather anomalies
- Controls: Thresholds tuned via cost curves; auto-hold above loss tolerance
- Lessons learned: Small, trusted corpora beat broad web; explainability drives adoption; iterate with shadow-mode before go-live

How clients moved from pilot to production: data contracts, guardrails, and human in the loop evaluation
Across sectors, the teams that crossed the chasm from proof‑of‑concept to scale did three things in lockstep: published explicit, machine‑readable data contracts (schemas, SLAs, lineage, and quality thresholds) and wired contract tests into CI/CD to stop drift at the gate; operationalized end‑to‑end guardrails (input allow/deny lists, PII scrubbing, policy prompts, output schemas, risk scoring, canary traffic, and spend caps); and kept human‑in‑the‑loop evaluation at the center with calibrated rubrics, stratified sampling, and on‑model “critics” that pre‑screen responses before escalation. The most durable rollouts paired product telemetry with review tools: every response carried a trace, a confidence score, a policy audit, and a reviewer hotkey; every model and prompt had a version, owner, and rollback. The result was not just safer AI, but a predictable release cadence where changes were observable, reversible, and continuously improved by real user feedback.
| Client | Domain | On‑model Role | Time‑to‑Prod | ROI (90d) |
|---|---|---|---|---|
| FinServCo | Support triage | Judge + Solver | 9 weeks | −28% handle time |
| RetailX | Catalog QA | Validator | 7 weeks | +2.3% AOV |
| MedOps | Note summarization | Draft + Redactor | 12 weeks | +19% clinician time |
| LegalOne | Clause review | Critic | 10 weeks | 0 policy incidents |
As adoption matured, evaluation shifted from pass/fail checks to risk‑weighted confidence. Teams mapped failure modes to expected cost, auto‑escalated low‑confidence cases to reviewers, interleaved A/B model candidates with human scoring, and measured outcomes beyond accuracy (deflection, time saved, error cost avoided). The repeatable pattern was simple and portable: small, enforceable contracts around the data, observable rails around behavior, and people supervising both the system and the signals it learns from. That combination yielded quieter on‑call, compounding training data, faster iteration loops, and clear executive‑level dashboards that tied model changes to business results.
- Version everything-data, prompts, policies, and models; make rollbacks boring.
- Design for graceful degradation with fallbacks to search, forms, or humans when confidence drops.
- Measure coverage, not just accuracy; track which intents/entities your evaluations never see.
- Keep policy close to the model via structured outputs, validators, and lightweight fine‑tunes for rules.
- Make feedback cheap-one‑click reviewer UIs and rubrics that fit in a minute.
- Treat cost as a product constraint with per‑route budgets and canaries before scale‑up.

ROI that stands up to finance: baselines, uplift measurement, and cost of quality
Our finance partners asked for numbers that survive audit, not slideware. We answered by instrumenting “on-model” AI with explicit baselines, matched cohorts, and a clean separation of booked versus realized benefits. Every workflow had a pre-registered measurement plan: which control to use, how to normalize seasonality, and what qualifies as uplift. We also tracked Cost of Quality (CoQ) end-to-end-prevention, appraisal, and failure-so any productivity claim had the corresponding quality delta attached. The result: changes in cycle time, accuracy, and rework are tied to cash-impacting outcomes, with variance explained and data lineage preserved.
- Baselines: A/A checks, shadow mode, and matched cohorts to establish the counterfactual before rollout.
- Uplift: Absolute and relative gains on business KPIs (not proxy model scores), normalized for mix and seasonality.
- Cost of Quality: Prevention/appraisal spend vs. internal/external failure; rework, refunds, leakage, escalations.
- Finance Guardrails: Booked vs. realized benefits, cash conversion timing, and OPEX/CAPEX clarity per deployment.
| Use Case | Baseline Metric | 30‑Day Uplift | CoQ Change | Net ROI (Quarter) | Note |
|---|---|---|---|---|---|
| Claims Triage | Median TAT 48h | -31% TAT | -18% failure | +142% | Shadow mode 2 weeks, CFO-signed |
| Marketing QA | Error rate 4.2% | -2.7 pp errors | -22% appraisal | +96% | Booked vs. realized split tracked |
| Support Automation | FCR 62% | +11 pp FCR | -15% rework | +128% | Seasonality normalized |
The common thread across case studies was measurable, controllable change. Each “on-model” agent exposed decision logs and quality grades at the step level, letting us attribute impact to specific prompts, policies, or tools-and retire ideas that didn’t pay. Finance valued the boring parts: locked baselines, pre/post windows, confidence bands, and clear pathways from operational metrics to cash. Lessons learned: align on units of value before code is written, pay down quality debt early to avoid leakage, and treat uplift as durable only after stabilization and CoQ reconciliation. That’s how improvements clear audit, survive quarter close, and compound over time.
Field tested lessons and recommendations: failure modes, governance checkpoints, and a rapid rollout plan
Across real client programs, the fastest wins came from refusing to guess: instrumenting every step, versioning every prompt, and establishing “good enough to ship” criteria before touching production traffic. The flipside was predictable-most misses traced to a few recurring failure modes that quietly eroded trust and ROI until they were named, measured, and boxed in by guardrails.
- Training-serving skew: pristine dev data, messy prod inputs → add schema checks, canonicalization, and strict input contracts.
- Prompt drift: conflicting instructions across system/user/tools → lock system prompts, template-version, lint prompts pre-merge.
- Retrieval blind spots: stale or sparse context → recency boosts, document health scores, fallback to baseline answers.
- Structured-output hallucinations: invalid JSON/SQL → constrained decoding, schema validators, sandbox execution.
- Feedback loops: model shifts user behavior and metrics → switchback tests, counterfactual logging, KPI guardrails.
- Cost and latency cliffs: token bloat, tool overuse → budget caps, caching, parallel tools, streaming responses.
Teams that scaled safely treated governance like traffic lights-clear, staged, and automated. Each release gate added evidence, not paperwork: auditable prompts and datasets, reproducible evals, calibrated human-in-the-loop thresholds, and a rollback that’s one click, not a prayer. Below are the checkpoints we saw stick, followed by a lean rollout that compounds confidence without stalling momentum.
- Scope + risk tiering: problem statement, user impact, harm analysis.
- Data controls: PII catalog, DLP policies, purpose limitation, retention.
- Evaluation: golden sets, adversarial/red-team tests, pass/fail bars.
- Traceability: dataset hashes, prompt/model/embedding versions, provenance logs.
- Human oversight: acceptance thresholds, escalation pathways, sampling rates.
- Monitoring SLAs: drift, bias, safety, p95 latency, cost per task.
- Incident response: kill switch, rollback plan, comms templates, postmortems.
| Phase | Users | Duration | Owner | Exit criteria |
|---|---|---|---|---|
| Sandbox pilot | 10-30 champions | 2 weeks | Product + ML | ≥95% task success; ≤1% critical safety |
| Guardrail hardening | 1 team | 2-4 weeks | Risk + ML | 0 P0 in chaos tests; jailbreaks blocked |
| Limited release | 10-20% traffic | 2 weeks | Ops | NPS ↑; cost/task on budget; p95 < 1s |
| Broad rollout | All users | 1-2 weeks | Program | 7 days incident-free; freeze tags set |
To Conclude
Across very different industries, a consistent shape emerged. When teams built “on-model” AI-systems fitted to their own operating model, data realities, and risk posture-returns were clearer, variance was lower, and lessons traveled. ROI rarely arrived as a headline moment; it compounded through fewer defects, shorter cycle times, steadier compliance, and reclaimed expert time redirected to higher-leverage work.
The most durable wins shared a few habits. Baselines were measured before lift-off. Guardrails were treated as product features, not afterthoughts. Human oversight was designed into the workflow, with crisp escalation paths and observable metrics. Training data reflected the work as it is, not as we wish it to be, and exceptions were used to update the system rather than to argue with it. Costs were tracked as a portfolio-build, operate, govern-not just model inference.
If you are considering your own path, start by naming the work: decisions to be made, tolerances for error, points of no return. Instrument what “good” looks like. Choose the smallest viable slice where feedback is fast and impact is meaningful. Expect drift, plan for audits, and make it easy for people to correct the system without breaking their flow.
These case studies are not a script, but a map. The next story will be yours. Begin by shaping the model to your way of working-and not the other way around.